BodePlotter
Frequency Response (Bode Plot)
For installer downloads and source code, please visit our GitHub Pages site:
BodePlotter
You can also browse the latest releases on GitHub:
Releases
Table of Contents
- Features
- Example RC Band Pass Filter Circuit
- Screen shots of bodeplots
- Software Usage
- Command Line Options
- Recommended Display
- Oscilloscope Setup
- Install on Windows 11
- Install USB Driver for Windows 11
- Install the .deb Package on Mint Linux (22.1)
- Remove the .deb Package on Mint Linux (22.1)
- Build the .deb Package
- Windows Build Process
- Issues
Features
1. Python Application with Briefcase
- Generates Bode plots.
- Accumulates peak FFT values.
- Displays an oscilloscope view.
- Offers X-Y mode and Lissajous pattern displays.
- Provides alternative plotting using the Matplotlib option for all chart types.
- Displays Smith charts using the Matplotlib option.
- Currently supports the OWON HDS320S (OWON HDS2202S is not tested but uses the same SCPI Interface)
2. OWON HDS320S Oscilloscope + Multi-Meter + Waveform Generator
- Bandwidth: 200 MHz
Sample Rate: 1 GS/s. - Sine Wave Generator: 0.1 Hz to 30 MHz.
- Outputs 300 samples per channel from the screen via SCPI.
3. Additional Information
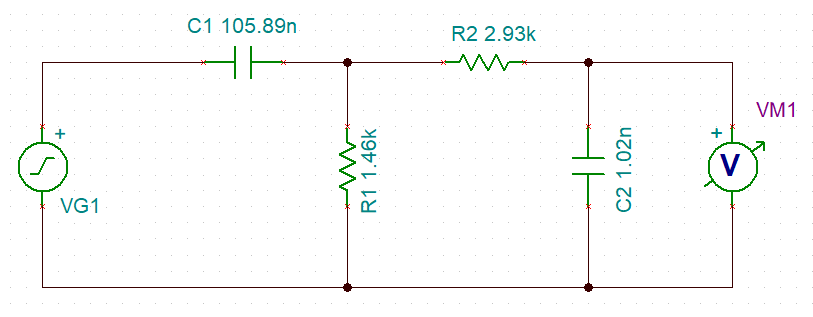
Example RC Band Pass Filter Circuit
- This example uses a passive RC Band Pass Filter.
- Measured values of the RC band pass filter circuit using the HDS320S multi-meter function:
- R1: Resistance of the lower cutoff resistor = 1.46kΩ
- C1: Capacitance of the lower cutoff capacitor = 105.89nF
- R2: Resistance of the upper cutoff resistor = 2.93kΩ
- C2: Capacitance of the upper cutoff capacitor = 1.02nF
Lower Cutoff Frequency (f1)
f1 = 1 / (2 * π * R1 * C1)

Given:
R1 = 1.46 [kΩ] = 1460 [Ω]
C1 = 105.89 [nF] = 105.89 × 10^-9 [F]

f1 = 1 / (2 * π * 1460 * 105.89 × 10^-9) ≈ 1029.5 [Hz]
Upper Cutoff Frequency (f2)
f2 = 1 / (2 * π * R2 * C2)

Given:
R2 = 2.93 [kΩ] = 2930 [Ω]
C2 = 1.02 [nF] = 1.02 × 10^-9 [F]

f2 = 1 / (2 * π * 2930 * 1.02 × 10^-9) ≈ 53.254 [kHz]
TINA-TIV9 Simulation of the Circuit
The circuit was simulated using TINA-TIV9 software. Below is the visual representation of the circuit setup:
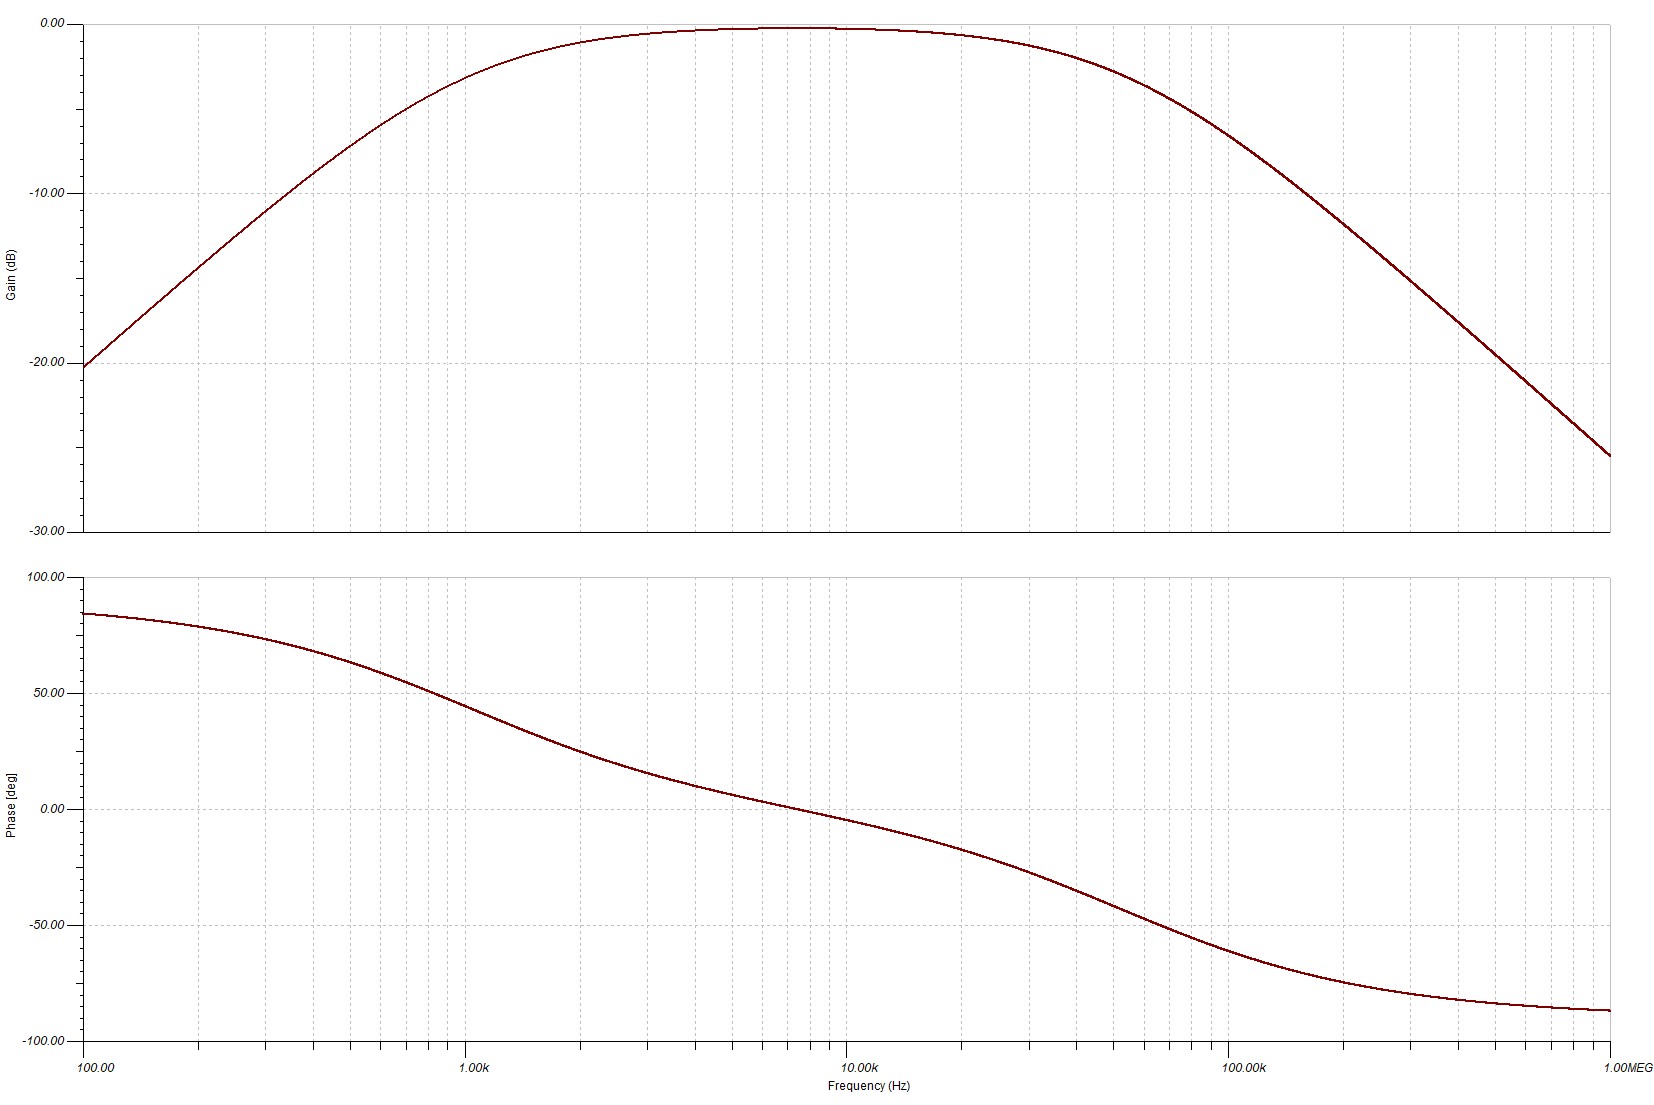
TINA-TIV9 Simulation Results
The simulation provided the following results, showcasing the circuit’s behavior:
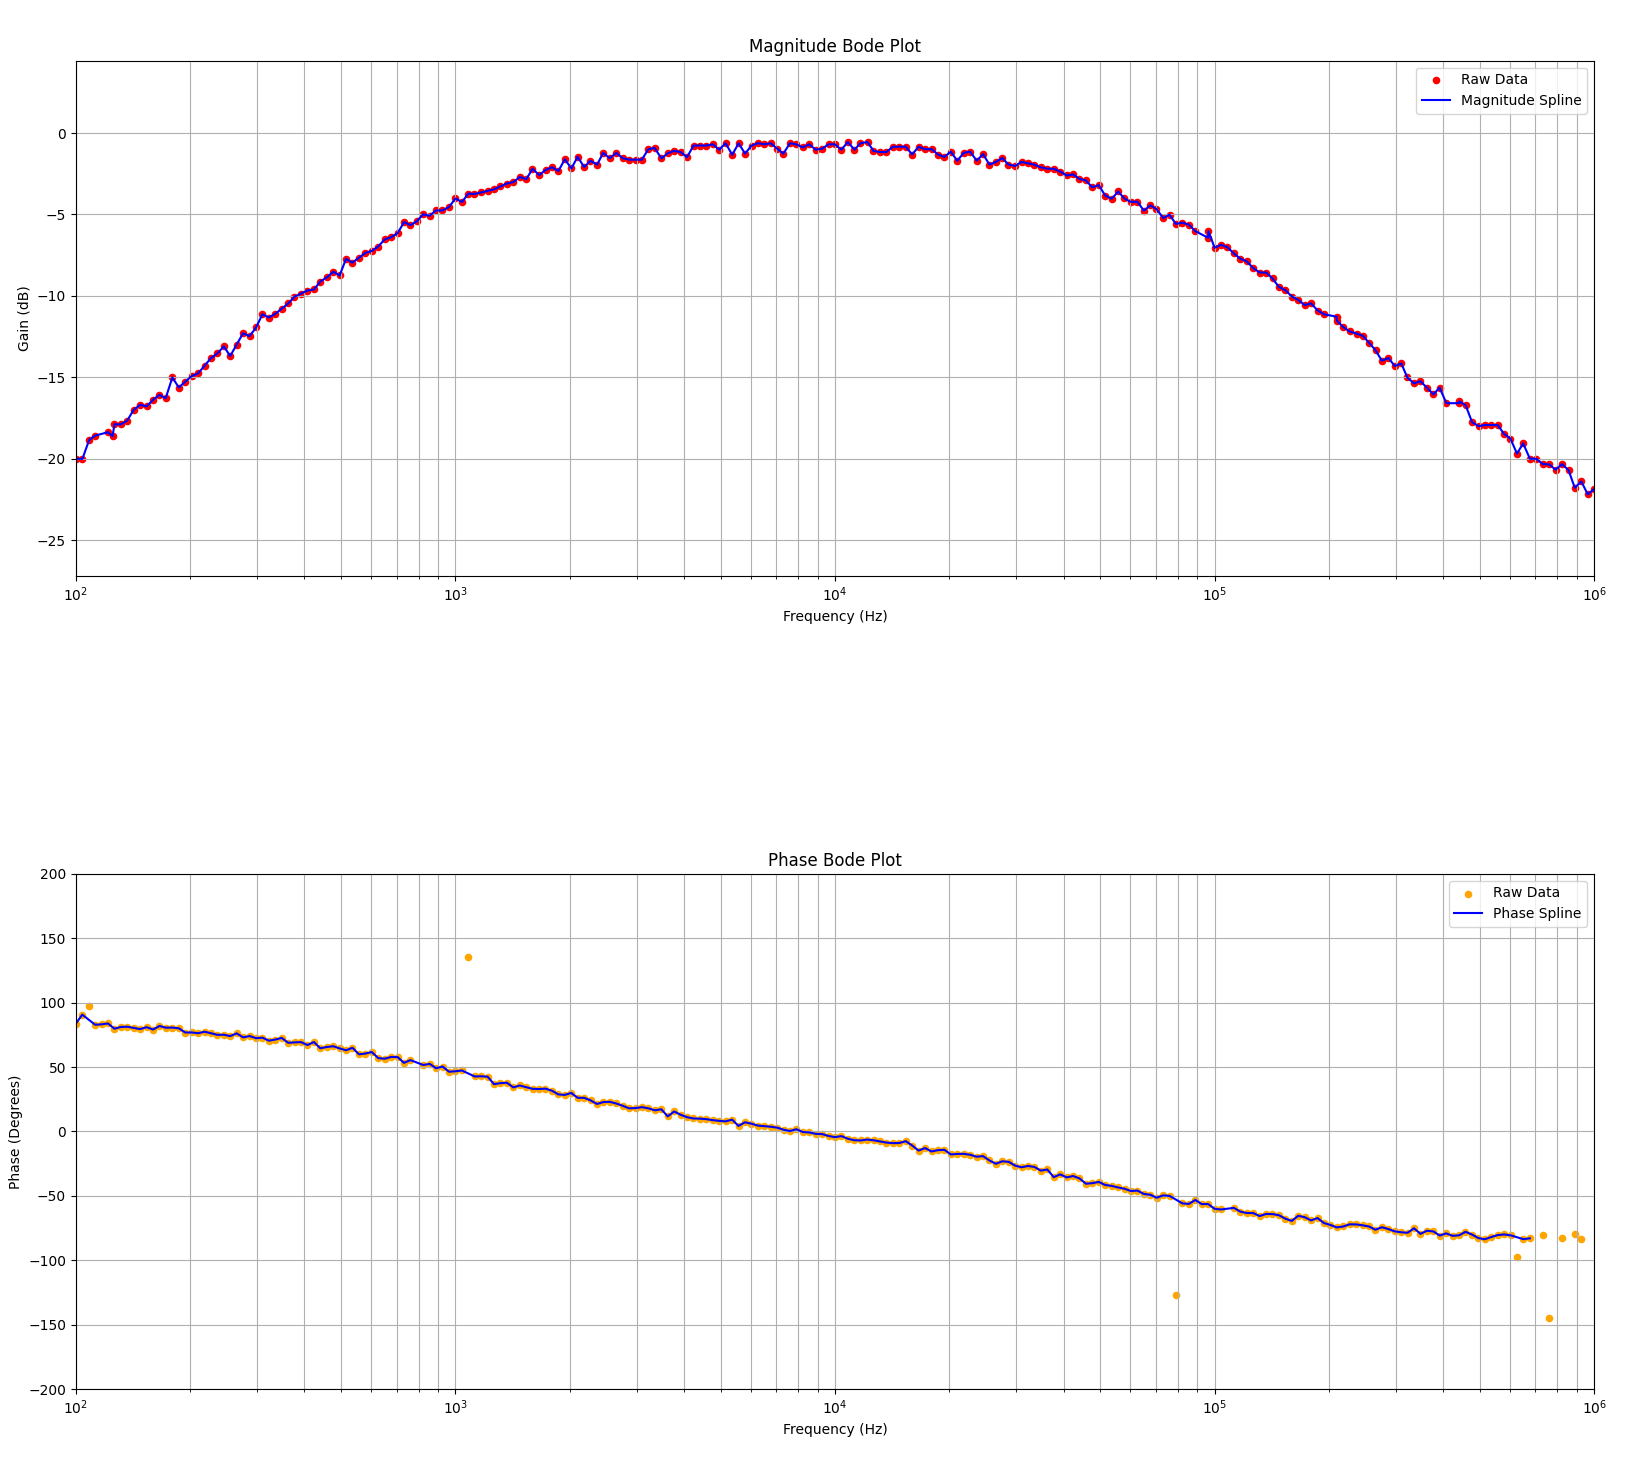
Bode Plots Using OWON HDS320S
The Bode plots were generated using the OWON HDS320S oscilloscope in conjunction with the Bode-Plots Python application:
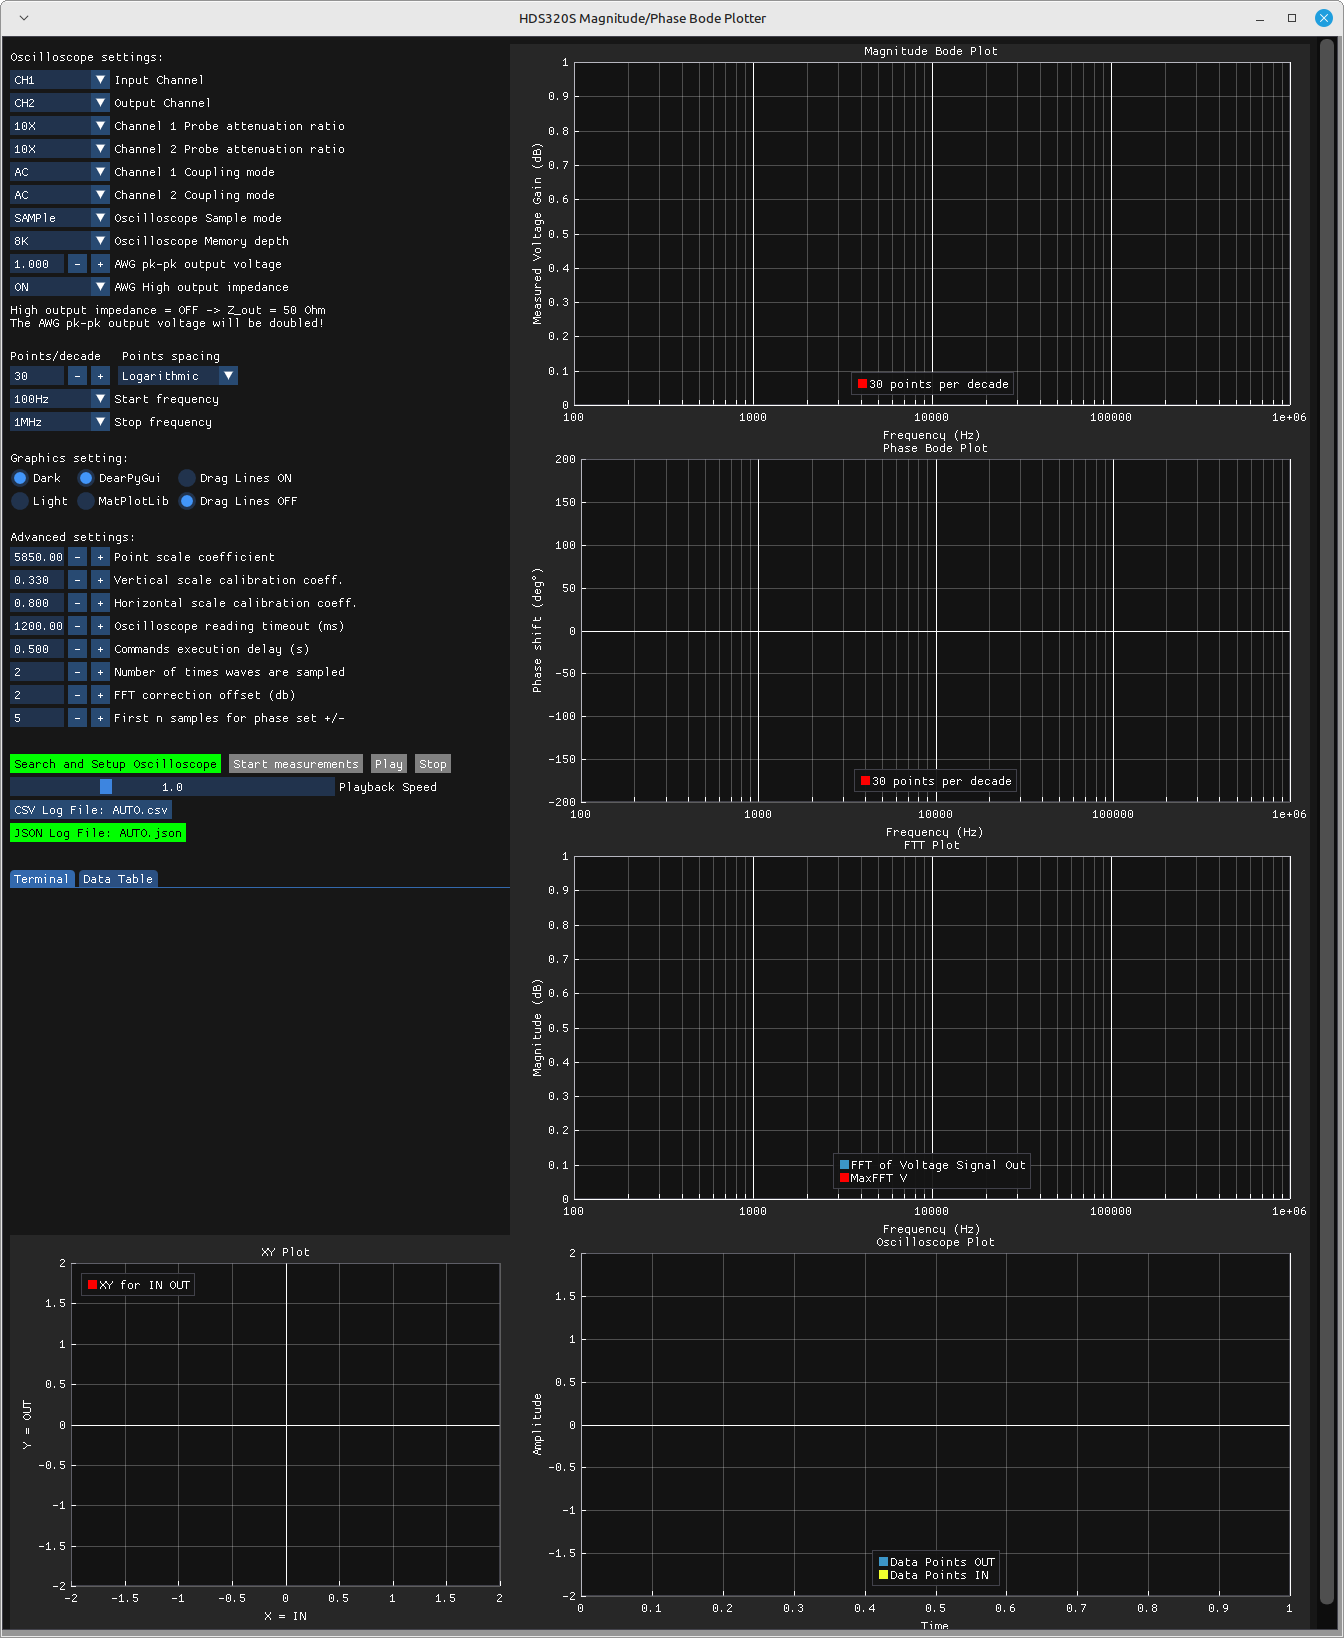
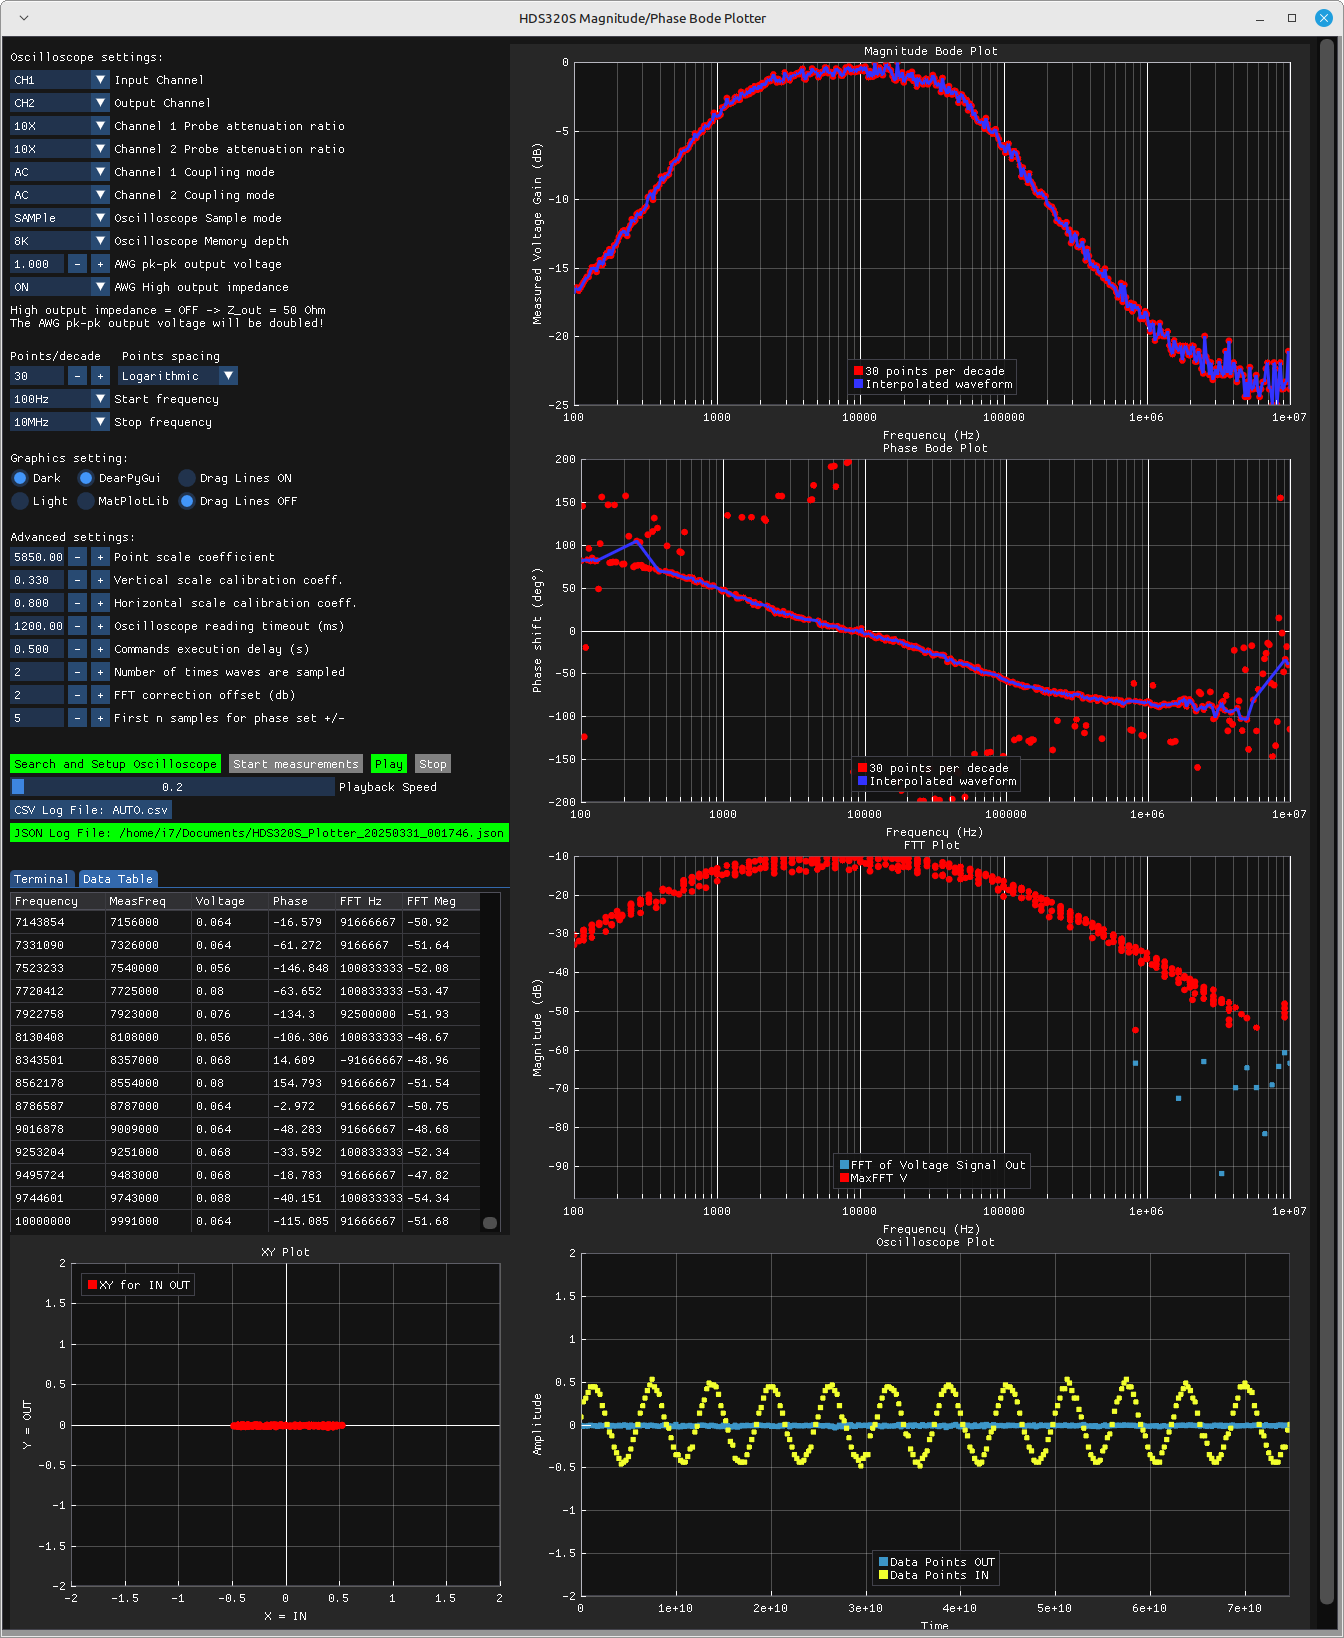
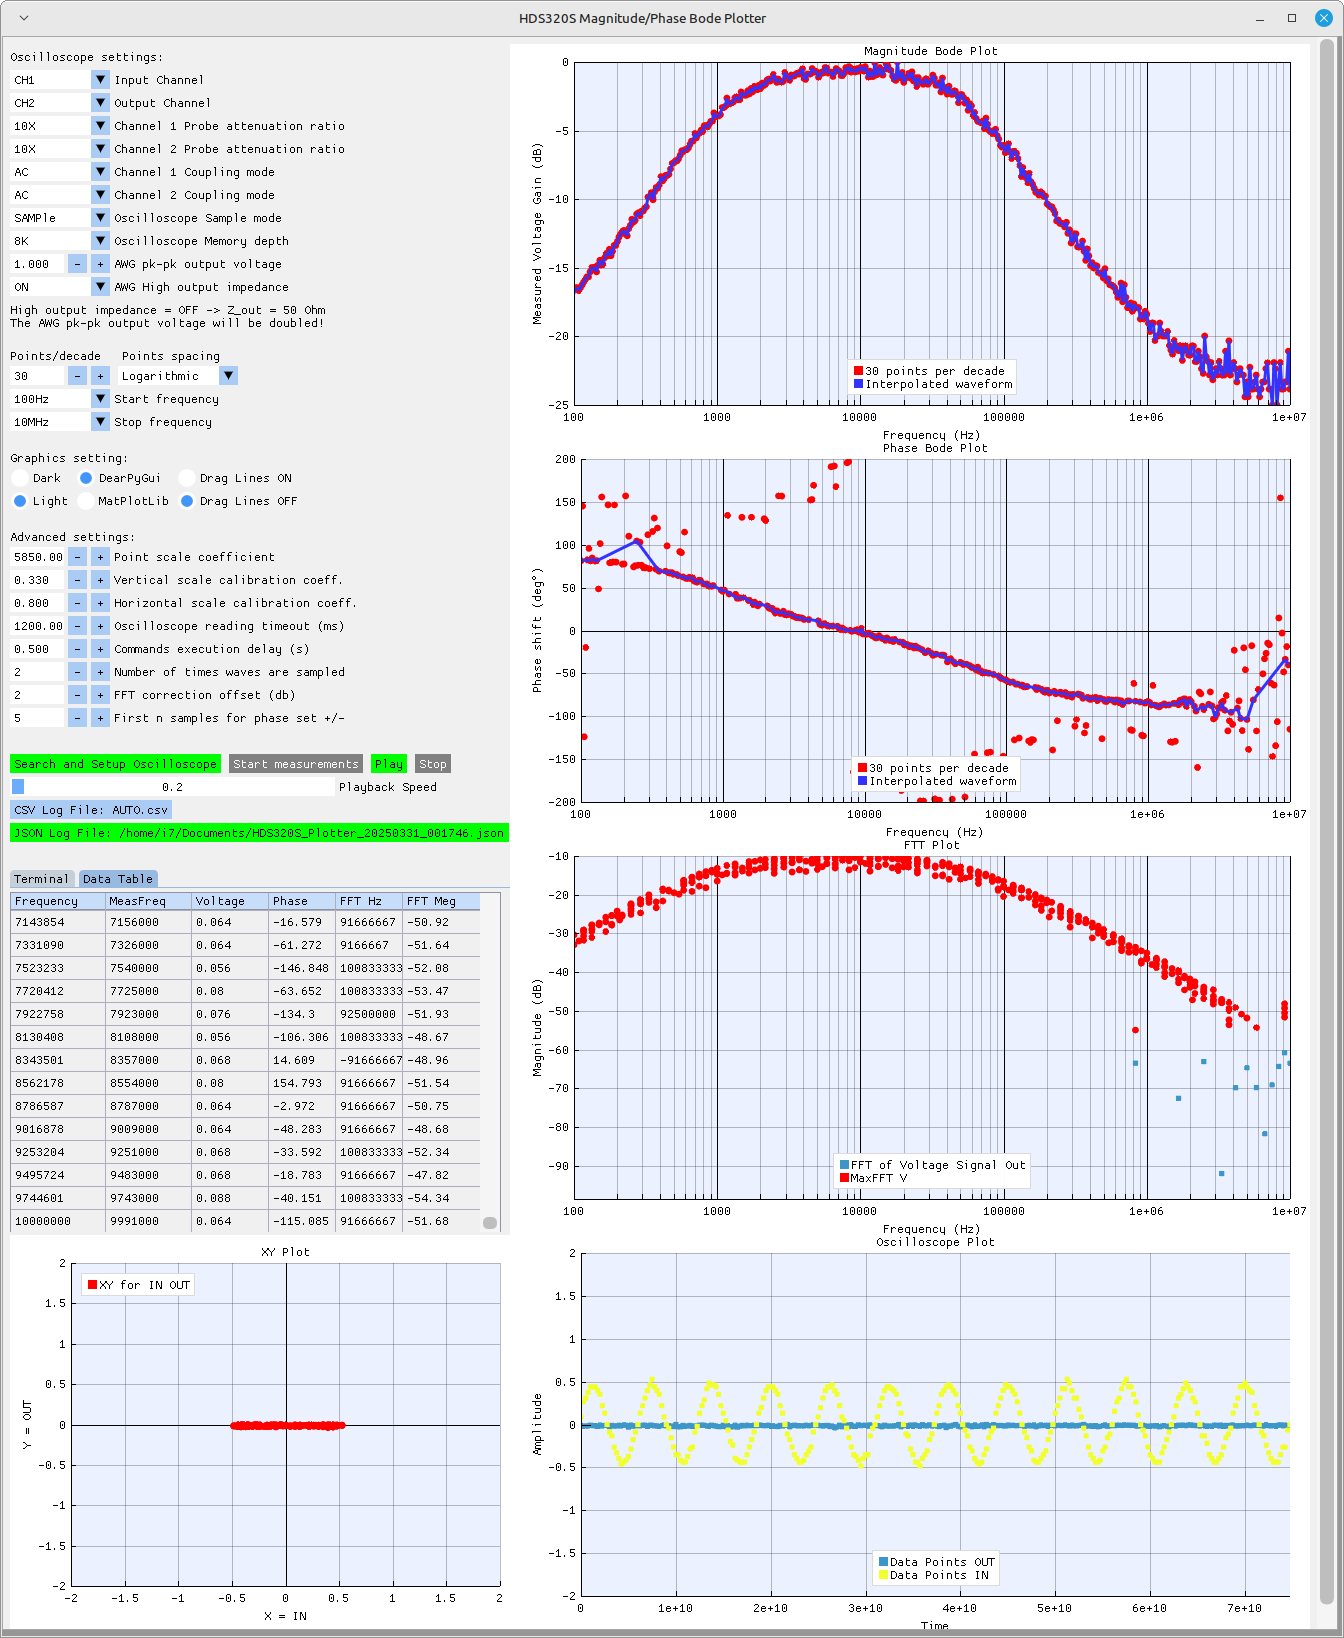
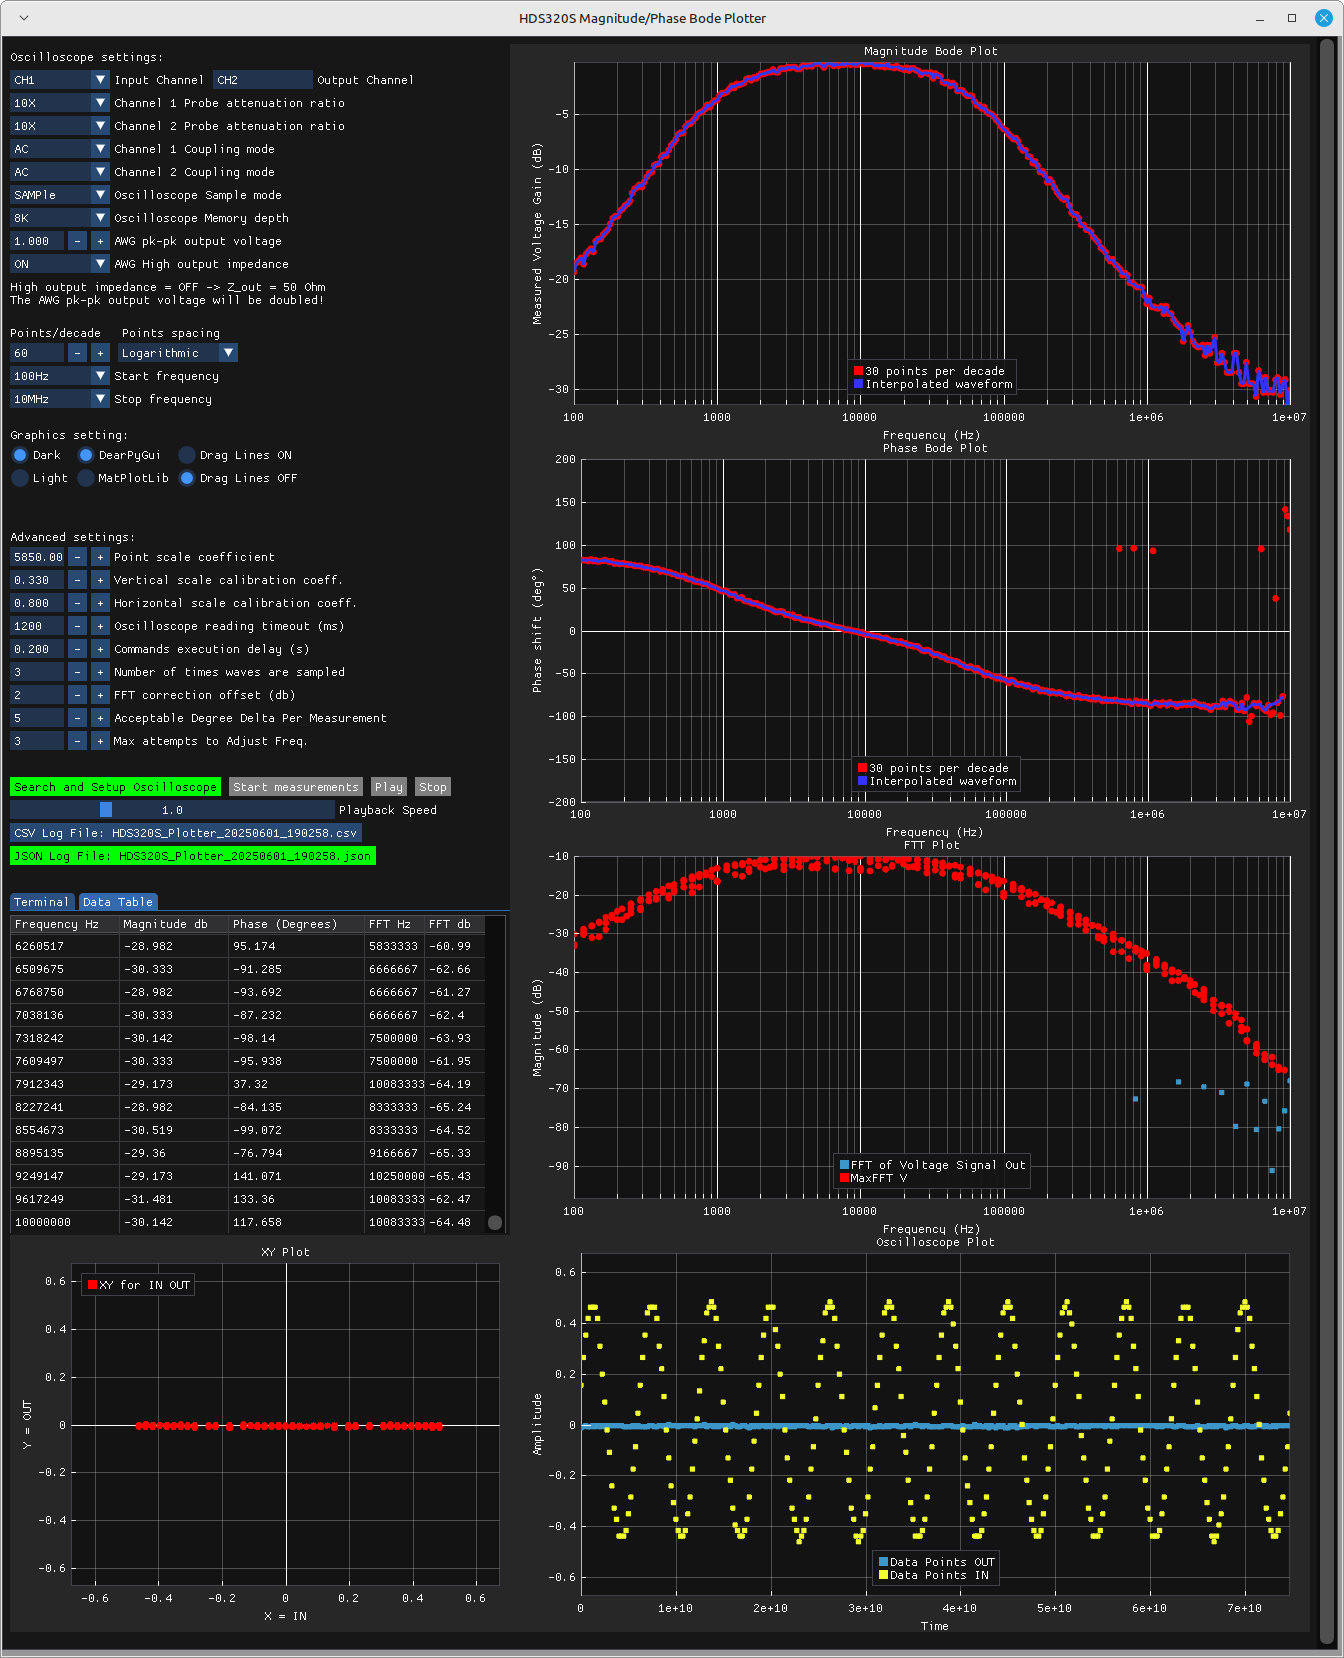
Screen shots of bodeplots
HDS320S Magnitude/Phase Bode Plotter window before Measurements or playback
HDS320S Magnitude/Phase Bode Plotter window Playback Dark Theme
HDS320S Magnitude/Phase Bode Plotter window Playback Light Theme
HDS320S Magnitude/Phase Bode Plotter window 1MHz to 10MHz getting into the noise floor
Watch the HDS320S Magnitude/Phase Bode Plotter window and MatPlotLib windows Playback Video
Watch the HDS320S Magnitude/Phase Bode Plotter window and MatPlotLib windows Video
Software Usage
- Launch the software via the command line (
bodeplots) or from the menu. - Verify oscilloscope settings and input desired parameters.
- Click Search and Setup Oscilloscope to initialize.
- Click Start Measurements (takes about 15 to 30 minutes).
- After completion, load the JSON log file for playback and analysis.
Command Line Options
- All inputs are used for Windows 11 process spawning except for
--base-port. - If the
--base-portoption is not specified, local ports 5001, 5002, 5003, and 5004 will be used to communicate with the Matplotlib windows.
usage: bodeplots.exe [-h] [--plot-type {XY,MP,FFT,SC,BODEPLOTTER}]
                     [--start-decade START_DECADE] [--stop-decade STOP_DECADE]
                     [--points-per-decade POINTS_PER_DECADE]
                     [--base-port BASE_PORT] [--leave-logs]

BodePlots Application

options:
  -h, --help            show this help message and exit
  --plot-type {XY,MP,FFT,SC,BODEPLOTTER}
                        Select the type of plot to display. Options: XY, MP,
                        FFT, SC, or BODEPLOTTER.
  --start-decade START_DECADE
                        Specify the starting decade for data processing.
  --stop-decade STOP_DECADE
                        Specify the ending decade for data processing.
  --points-per-decade POINTS_PER_DECADE
                        Specify the number of points per decade for the plot.
  --base-port BASE_PORT
                        Specify first IP port for + 0, + 1, + 2, + 3 ports.
  --leave-logs          Leave log files and temp directories intact on exit
                        and, on Linux, output logs to console.
Recommended Display
- 4K Display (4096x2160) preferred; minimum 1600x1200 resolution.
- VirtualBox with Mint Linux 22.1 works well.
Oscilloscope Setup
- Connect the oscilloscope to your PC using a USB cable (preferably with Ferrite Rings to reduce noise).
- Set HDS320S to default:
- Press System → F3 (Default Setting) → Confirm.
- Connect probes:
- CH1 (yellow lead) to circuit input.
- CH2 (blue lead) to circuit output.
- Gen Out to input ground.
Install on Windows 11
- Download Bode-Plots-0.0.6.msi and double-click it in File Explorer.
- Follow the installation prompts: Next → Next → Finish.
- Open “Bode” from the Windows Start menu.
- Adjust vertical height as needed.
- Install USB Driver for Windows 11 using Zadig.
Install USB Driver for Windows 11
-
Download and Install Zadig
Download zadig-2.9.exe to install the drivers for the OWON HDS320S. -
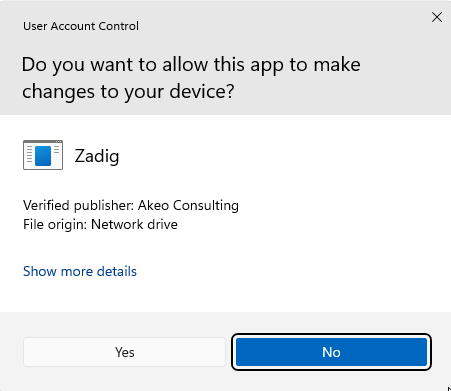
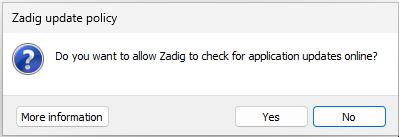
Allow Device Changes
When prompted, allow Zadig to change Windows 11 device settings by clicking the Yes button.
-
Allow Updates
When prompted, allow Zadig to check for updates by clicking the Yes button.
-
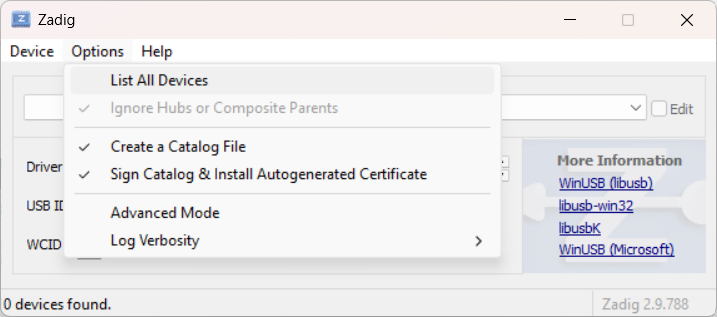
Detect USB Device
Ensure your HDS320S is plugged in and powered on. Zadig should detect the USB device otherwise select from list.
-
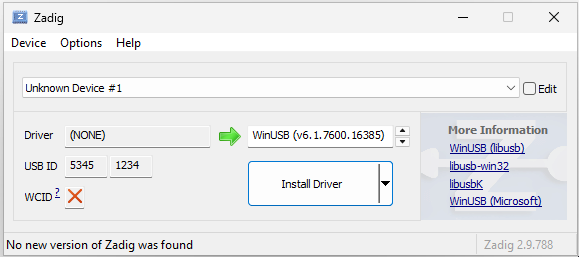
Detect USB Device
Correctly selected USB device will have USB ID 5345 1234.
-
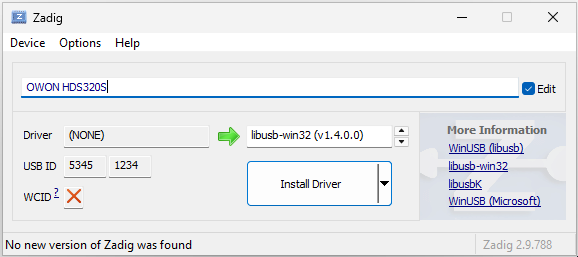
Select the Correct Driver
In the driver details, rename the device to OWON HDS320S. Then, use the drop-down arrow to select libusb-win32 (v1.4.0.0).
-
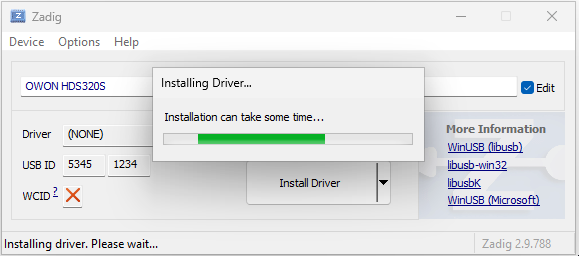
Install the Driver
Click the Install Driver button and wait for the installation to complete.
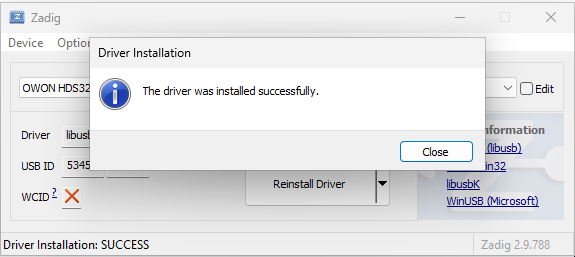
-
Successful Installation
Zadig should report that the driver was installed successfully.
Install the .deb Package on Mint Linux (22.1)
- Download: bodeplots_0.0.6-1~linuxmint-xia_amd64.deb.
- Open a terminal and run:
sudo apt install ./bodeplots_0.0.6-1~linuxmint-xia_amd64.deb
Remove the .deb Package on Mint Linux (22.1)
- Open a terminal and run:
sudo apt purge bodeplots
Build the .deb Package
- Use Live Mint (22.1) via VirtualBox or a local installation.
- Download: bodeplots-source-code.tgz.
- Follow these steps:
mkdir BodePlotter-ScopeFFT
mv ~/Downloads/bodeplots-source-code.tgz BodePlotter-ScopeFFT
cd BodePlotter-ScopeFFT
apt update
sudo apt install python3-virtualenv git
virtualenv bodeplotter -p python
source bodeplotter/bin/activate
pip install --upgrade pip
pip install briefcase numpy dearpygui matplotlib pyusb scipy screeninfo PyQt5
tar zpxvf bodeplots-source-code.tgz
cd bodeplots
rm -rf build/bodeplots
briefcase create
briefcase update -r
briefcase build
briefcase package
Package file location:
dist/bodeplots_0.0.6-1~linuxmint-xia_amd64.deb.
Windows Build Process
Environment Setup for Windows 11
- Install Latest Microsoft Visual C++ Redistributable:
- Install Git:
- Install Python and dependencies via PowerShell:
mkdir C:\BodePlotter-ScopeFFT cd C:\BodePlotter-ScopeFFT python # or https://www.python.org/downloads/release/python-3132/ # https://www.python.org/ftp/python/3.13.2/python-3.13.2-amd64.exe python -m venv bodeplotter .\bodeplotter\Scripts\activate python.exe -m pip install --upgrade pip pip install briefcase numpy dearpygui matplotlib pyusb scipy screeninfo PyQt5 - Extract source code and build: bodeplots-source-code.tgz
cd C:\BodePlotter-ScopeFFT .\bodeplotter\Scripts\activate cd .\bodeplots briefcase create windows app briefcase update -r briefcase update briefcase build -v briefcase run -u briefcase package windows - Packaged MSI:
dist\Bode-Plots-0.0.6.msi.
Issues
- Smith Chart Normalization:
- The Smith chart is currently not normalized. When the magnitude for an active filter exceeds 0 dB, the plot area scales dynamically to accommodate the data, causing the rendered chart to extend outside the standard Smith chart boundaries.
- Matplotlib Performance on Windows 11:
- On Windows 11, Matplotlib may struggle to keep pace at higher playback speeds where the slider value is less than 0.6:
- If Matplotlib is selected, starting measurements or playback may exceed 90 seconds before additional windows load.
- Matplotlib windows are not automatically closed when DearPyGui exits, which can leave log files and temporary files in the user’s TEMP directory.
- bodeplots will clear BodePlotter_* directories in %TEMP% that are over an hour old.
- Using Matplotlib within threads makes DearPyGui unstable; therefore, a new process per Matplotlib window is used instead.
- Current Implementation:
- Using the
console_appflag inpyproject.tomlto open a blank console. The advantage of the console is that you can press CTRL+C to close all Bode-Plots windows. - It is recommended to stop active measurements or playback before proceeding, allowing port connections to close gracefully without generating crash dumps.
- If you would like to hide the console, consider creating a
bode-plots.vbsscript. If you encounter issues with invalid characters, open the file in Notepad++, select Encoding → Convert to ANSI, and then save the file. For example:Set WshShell = CreateObject("WScript.Shell") WshShell.Run "cmd /c bodeplots.exe", 0, True Set WshShell = Nothing
- Using the
- Current Implementation:
- On Windows 11, Matplotlib may struggle to keep pace at higher playback speeds where the slider value is less than 0.6: